Ever pondered how much your company invests to pay, incentivise, equip and fully mobilise the sales force to deliver the revenue budget they are set? Ever wondered what impact reducing the investment by 10% would have on the ability to deliver the revenue budget? What if the revenue budget was increased by 10%….what increase if any, would be required in the investment on the sales team? What would happen to the revenue budget if there was no sales team at all?
Ever thought that calculating and modelling your Sales Team productivity and RoI could be likened to an accounting equation, where the left hand side has to equal to right hand side? Neither did I until this universal truism dawned on me many years ago. It has always been there……all I did was simply realise it and articulate it. As I attempted to write it down, I realised that the left hand side equalling the right hand side depends on one’s perspective………..LHS = RHS is ideal from a productivity perspective. “Significantly less than” is true from a RoI perspective. Here is the equation…..

Too simplistic for those of you more mathematically inclined? Here it is again expressed with some more detail ………..
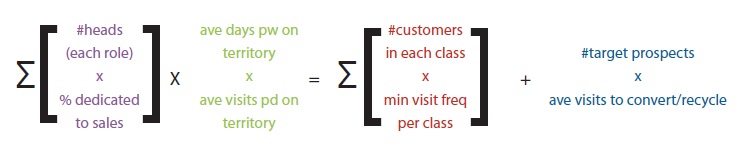
The equals sign aligns to the Sales team productivity modelling pursuit. This version aligns to the RoI on the Sales Team ………….
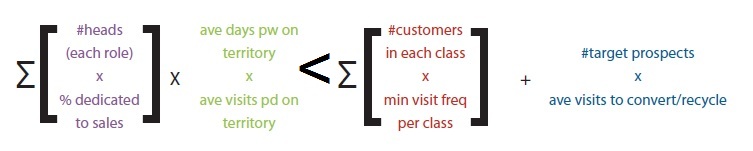
ie: Cost Base < Revenue Base
Why is this important? These days, in many B2B sales environments the cost of a sales visit ranges from $100-400. The cost of fully equipping and supporting a Sales Exec ranges from $100K pa to $400K pa. We have seen Sales Execs spend up to 50% of time on sales admin and support tasks, and only manage 5-10 visits per week. Sales Team productivity can be monitored, measured and managed with the rigours that our colleagues in Finance like to apply to their trade.
Previous month’s blogs have outlined the principles for classifying the customer base for superior field targeting. This is the leg-up you need for optimising your customer coverage. Previous month’s blogs have outlined the principles for optimising prospect pipeline specification for superior prospect penetration.
But how do you model the various Sales Team productivity : RoI scenarios? For example, maybe you are reconsidering your options in terms of reducing cost of sales by reducing headcount. Or what increasing head count will do for your sales effectiveness? What is a reasonable visit productivity rate to set? And how do you model a range customer coverage scenarios? Or superior prospect conversion rates…………..or the number of visits required per prospect to get the conversion rate to a particular target level? Click here to access a tool that can assist with any of these critical considerations.
Next month we are going to discuss Sales territory structuring – driving for maximum efficiency and visit productivity. We are sure you will benefit from this bulletin.
Visiting The Next Level’s website can help put this discussion in perspective. Or simply send us a message via the Contact Us section and we will gladly answer any questions you may have or organise to come out and have a discussion as to what The Next Level Sales System can do for you and your business.
Good to break down the cost of sales in such a way Glenn. Many sales execs would be shocked when they see the result per visit when it is broken down via your model – good initiative mate.