Last visit to this topic finished with elaborating on the horizontal angle of this matrix. 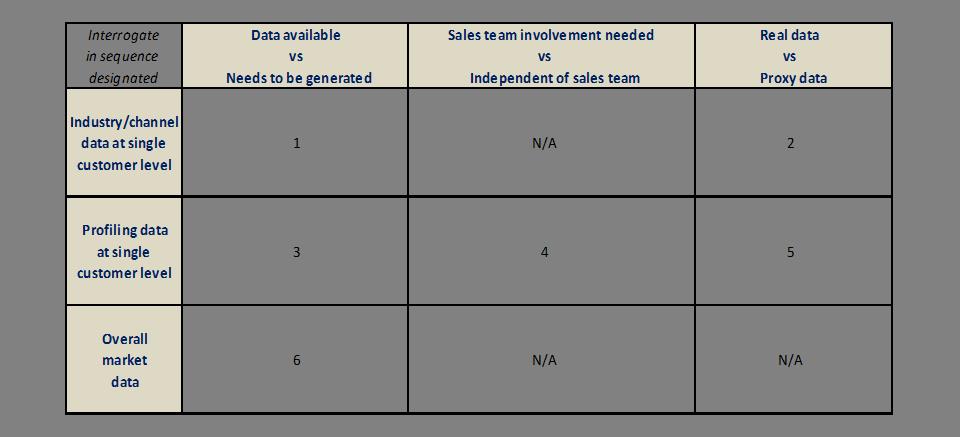
Now to finish this topic and series with the vertical angle perspective of the same matrix.
Here, your ideal scenario, is that industry data is available to be used for your PV (potential value data for all customers and prospects). For example, in some industries, volume and revenue data for entire categories can be accessed by suppliers/manufacturers for their customers. In other industries, volume and revenue data may not be available but external industry data can be accessed and used as PV proxies for volume and/or revenue (eg number of high care beds in Aged Care Facilities).
If the ideal is not available to you, and you need to turn to generating your own PV data, the question then spotlights the role of the sales team in assisting (and owning the process and data!). I have oft argued in posts like this, that B2B sales teams should do this sort of profiling as an integral ingredient of sales process and account management best practice anyway. It is the essence of CRM.
Finally, and the last, right hand side vertical column …. Whether you find yourself in the ideal scenario above, or the more “normal”(immediately above), you need to determine whether your PV “currency” will be real (revenue or volume), or some proxy unit to proxy for revenue or volume.
In any case, back to my topic/heading ………… The discipline of PV (potential value) data collection…. you and your sales process cannot avoid the imperative.