Picking up the threads from last week……the how and why of gathering PV data, I was caused to reflect on this segue today when shooting the breeze over a coffee with one of my confidantes associated with the Enterprise Connect scheme. He bemoaned the high frequency in which he recommends to organisations to undertake a thorough market assessment to support their sales process, only to find to his dismay, they respond by throwing the latest IBIS World industry report into their “strategic plan”. We simultaneously lamented why so many companies do not do the hard work. A true market analysis needs, ultimately, to plumb the depths of assessing each customer’s and known prospect’s PV (potential value – as defined in last week’s post). And here is the model to help:
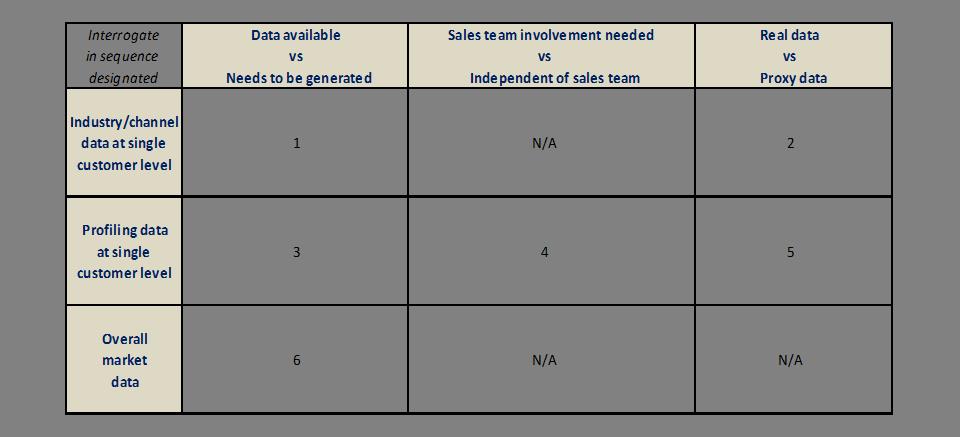
As you can see, it is a 3 x 3 matrix.
First vector (horizontal in the model above). The holy grail is to access data that is directly PV by definition and specific to each customer and prospect – data sourced from industry or channel partner sources. If that is not available, the next best is to engage your sales team (if they haven’t already done so as standard sales process practice!) to profile each customer /prospect against a pre-agreed and standardized set of profiling characteristics. That can be converted into proxy scores – proxying for PV. When both those means are not available to you then all is not lost, and you can engage the sales team in a desktop exercise that leverages their knowledge of customer/prospects to differentially allocate them into segments of an appropriate PV shape-of-curve that is reflective of your market. A kind of “forced distribution” exercise, that is bound by the known size of your market.
Come back next week and we will finish off the vertical vector and summary call to action in this little post series.