Sales Team Optimisation
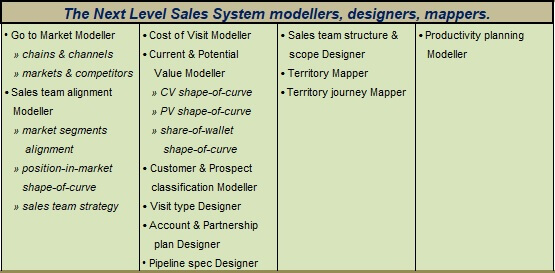
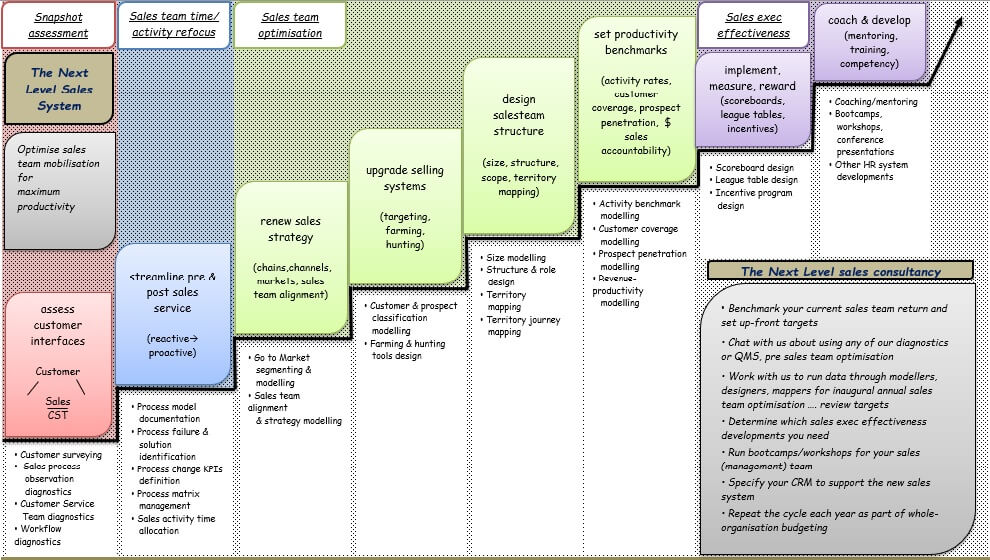
We use our specifically designed modellers, designers and mappers to guide you through the sales team optimisation process

Go to market sales strategy survey
Management complete an online survey which facilitates the prioritisation of key challenges and opportunities facing participant organisations.
- Critical success factors in response to these opportunities and threats are identified
Go to market modeller
» chains & channels
Facilitates review, challenge, renew regarding the value chains and distribution channels environment and the current Go-to-Market strategy in which the Sales organisation operates
- Produces clearly documented value chains, distribution channels detail and definitions in terms of “what do we sell; via whom; to whom; by whom”
» markets & competitors
- Facilitates review, challenge, renew of markets in which the Sales organisation competes, and qualifies and quantifies the competitive landscape accordingly
- Produces clear definition and competitive specification of markets, in terms of who is the final owner, consumer, user of the end-form fully value added product
Sales team alignment modeller
» market segments alignment
- Facilitates review, challenge, renew regarding current Sales team deployment vs segments and markets of customers/prospects as they relate to the value chain and environment
- Produces clearly documented customer/prospect segments and size details vs sales team (role types) alignment
» position-in-market shape-of-curve
- Facilitates the assessment of the competitive dynamics of the markets in which the sales team(s) are currently and then proposed to be aligned
- Produces a curve that shows the relationship between competitors and respective market shares as a consolidated market that relates to each aligned Sales team
» sales team strategy
- Facilitates review, challenge, renew regarding the sales direction for each segment – balance of farming vs hunting effort and trading terms approach
- Produces revised Go-to-Market strategy as it relates to optimal utilisation of the Sales team(s) and how they will exert buyer behaviour influence along relevant segments of the chains/channels/markets
Cost of Visit modeller
- Quantifies which customers “pay for” face to face account management; and which customers don’t achieve “break even”
- Produces the cost of visit in terms of the cost of sales and cost of service contributions
Current and Potential Value modeller
» CV shape-of-curve
- Quantifies the degree of polarisation and vulnerability of the current business, as it relates to the existing customer base
- Produces a curve that shows the relationship between customers and sales contribution, and quantifies the unique Pareto ratio, mid-slope and tail-end populations
» PV shape-of-curve
- Quantifies the degree of polarisation and spread and attractiveness of potential business, as it relates to the existing customer base
- Produces a curve that shows the relationship between customers and potential sales value, and quantifies the unique Pareto ratio mid-slope and tail-end populations
» share-of-wallet shape-of-curve
- Facilitates meaningful debate on current vs target Share-of-Wallet as it relates to consolidated current and potential value of the customer base
- Produces a curve that shows SoW differences in the top group of customers compared to the mid group and the tail end group
Customer and Prospect Classification modeller
- Models the outputs of previous modellers with specific data inputs with management judgements to set boundaries for customer and prospect classification in relation to potential value plotted on a scatter chart
- Produces a scientific and objective division of which customers deserve active account management; which ones warrant a lower cost form of sales and service maintenance and a listing of classified customers and prospects for sales team visit targeting and optimum productivity
Visit type Designer
- Facilitates development of tailored visit types that add bilateral value and underpin partnership programs with top class customers; quantifies modelable typical visit
- Produces the fundamentals and definitions of visit activity effectiveness via a focus on ways to add value beyond simple sales and service relationship – the suite of programmable valid business reasons
Account & Partnership Plan Designer
- Facilitates development of tailored Account Plans to develop top class customer growth strategies and Partnership Plans to develop mutual growth programs for farming top class customers
- Produces the templates for Sales Exec Account planning, and collaborative Partnership planning with top class customers
Pipeline Designer
- Facilitates development of tailored pipeline tools and processes for optimum measurement and performance management in regards to hunting prospects and/or opportunity management
- Produces pipeline and hunting:trapping process and measurement
Sales team structure & scope Designer
- Facilitates debate on the range of design elements for the critical B2B sales organisation that need to be considered
- Produces documented definitions and details across the role types, bandwidth, structure and deployment elements
Territory Mapper
- Facilitates mapping to adjust and optimise Territory : Sales Exec deployment for workload balancing
- Produces a map of the region in question with evenly workload-balanced territory boundaries and individually tailored territory : Sales Exec activity and targeting productivity benchmarks
Territory journey Mapper
- Facilitates mapping to adjust intra territory routing to optimise Sales Exec territory planning and to optimise driving efficiencies and customer coverage
- Produces a map of each territory coded into sub-regions and itinerary routes
Productivity planning Modeller
- Models outputs of previous modellers to facilitate review,challenge,renew of sales team headcount; visit activity rates; balance of customer coverage and targeting; breadth and depth of prospect penetration – the 6 key drivers of Sales team productivity
- Produces new plan and benchmarks for sales team productivity and RoI in terms of sales team headcount; visit activity rates; balance of customer coverage and targeting; breadth and depth of prospect penetration, with linkages to revenue targets
Scoreboard design
- Facilitates development of suite of standard indicators for all members of sales team to focus activity and performance to align with the new sales system – for each Sales exec, scoreboard style
- Produces an IT specification for standard suite of indicators – activity inputs; process outputs; financial outcomes – for each Sales exec, scoreboard style
League table design
- Facilitates development of suite of standard indicators for all members of sales team to focus activity and performance to align with the new sales system – for all Sales execs, ranked top to bottom for each indicator – league table style
- Produces an IT specification for standard suite of indicators – activity inputs; process outputs; financial outcomes – for each indicator, all Sales execs, league table style

